Between the Nifty 50 Vs Nifty 500 Index Fund, which one do you have to choose? Let us find the answer based on the last 21 years of data.
Every index fund investor eventually faces the same question: “Which broad-market index should be my core holding?” The usual suspects are the Nifty 50 TRI, the Nifty LargeMidcap 250 TRI (NLM 250), and the Nifty 500 TRI. Each has a distinct pitch — Nifty 50 for simplicity, NLM 250 for higher returns, and Nifty 500 for true market breadth.
This article uses actual NSE India TRI data spanning April 1, 2005 to March 2026 — 21 years, 253 monthly observations — to answer the question properly. We examine lump sum growth, drawdown profiles, rolling returns across 1, 3, 5 and 10-year windows, and rolling standard deviation. After going through all the data, we arrive at a clear view on which index makes the most sense for most long-term investors, and why Nifty 500 emerges as the most practical choice.
Nifty 50 vs Nifty 500 Index Fund: Which One Should You Pick?
Let us first understand what are these Indices are all about. Here, for the comparison, I have taken the Nifty 50, Nifty Large Midcap 250 Index and the Nifty 500 Index.
Nifty 50 –
The Nifty 50 covers 50 large-cap stocks and represents approximately 55.5% of NSE’s total free-float market capitalisation. It is dominated by Financial Services, IT, Oil & Gas, and FMCG. The index covers only 14 out of 21 sectors at NSE. It is the most liquid, most researched, and most tightly tracked Indian index — passive funds tracking it have the lowest tracking error and impact costs in the market. Think of it as a portfolio of India’s 50 most dominant businesses, market-cap weighted.
Nifty Large Midcap 250 Index –
The NLM 250 is a 50-50 blend — it mandatorily allocates 50% weight to the Nifty 100 (large caps) and 50% to the Nifty Midcap 150. This equal-part construction is not market-cap weighted at the segment level — it is a rule-based equal allocation between large and mid caps, reset quarterly. This is the critical distinction: NLM 250’s midcap exposure is structurally forced to be 50%, regardless of where market capitalisation actually sits. As a result, mid caps get a far higher weight in NLM 250 than their actual market-cap share warrants. This is exactly what drives both its higher returns and its higher risk.
Nifty 500 Index –
The Nifty 500 is the broadest benchmark in this comparison. It covers 500 companies and represents approximately 92.3% of NSE’s total free-float market capitalisation — by far the widest coverage. Critically, it is fully market-cap weighted — meaning each stock gets a weight proportional to its actual size in the market. The approximate current composition is:
• Nifty 50 (top 50 large caps): ~58.6% weight
• Nifty Next 50: ~12.2% weight
• Nifty Midcap 150: ~18.5% weight
• Nifty SmallCap 250: ~10.7% weight
This means Nifty 500 gives you genuine exposure to India’s entire listed equity universe — but in proportion to economic weight, not arbitrary equal-allocation. The mid and small-cap exposure is real but proportional and naturally controlled, unlike NLM 250’s hard-coded 50% midcap mandate.
Lump Sum Invested –
Let us now understand what if someone invested Rs.1 lakh in these three Indices, then what may be the current value. I have considered the base date as 1st April 2005 mainly because the Nifty Large Midcap 250 Index base starts from 1st April 2005.
What did Rs.1 lakh invested on April 1, 2005 actually become after 21 years of staying fully invested through every crisis and recovery?

| Index | CAGR p.a. | Rs.1L in 21Y | Max Drawdown | Market Cover |
| Nifty 50 TRI | 13.50% | Rs.14.29 L | -59.5% | ~55.5% of NSE |
| Nifty 500 TRI | 13.74% | Rs.14.93 L | -63.7% | ~92.3% of NSE |
| NLM 250 TRI | 15.17% | Rs.19.41 L | -67.6% | ~87.0% of NSE |
The chart tells a clear story. All three indices delivered substantial wealth creation — turning Rs.1 lakh into Rs.14–19 lakhs. But the gap between NLM 250 and the other two is significant: Rs.5.12 lakhs extra per lakh invested versus Nifty 50, and Rs.4.48 lakhs extra versus Nifty 500. This is the power of a 1.67% annual CAGR advantage over 21 years.
However, Rs.14.93 lakhs for Nifty 500 versus Rs.14.29 lakhs for Nifty 50 is also worth noting. Nifty 500’s advantage over Nifty 50 is Rs.64,000 per lakh invested — modest in rupee terms, but achievable with meaningfully lower structural complexity and a more diversified portfolio.
NLM 250 wins on absolute return — but Rs.5.12L extra came at the cost of 8.1% deeper crashes and far more volatile holding experience.
Nifty 500 beats Nifty 50 by Rs.64,000 per lakh — modest premium, but covers 500 vs 50 companies and 92% vs 55% of the market.
The return gap between Nifty 500 and Nifty 50 is small enough that most investors would not notice — but the diversification benefit is real and structural.
Drawdown –
Now let us understand the drawdown of all these indices.
This is the chart that separates investors from traders. Drawdown measures how far below its own all-time high each index was at any point — computed from daily data, displayed monthly. This is the pain you would have actually lived through as an investor. It is not a statistic on paper; it is the number you stare at in your portfolio app during a market crash.

The 2008 Market Crash
All three indices crashed severely, but not equally:
• Nifty 50: -59.5% from peak, trough October 27, 2008
• Nifty 500: -63.7% from peak, trough October 27, 2008
• NLM 250: -67.6% from peak, trough March 9, 2009 — 4.5 months LATER than Nifty 50
Two things matter here. First, Nifty 50 bottomed 4.5 months before NLM 250 — large caps attract institutional buying first during crises. NLM 250’s forced 50% midcap exposure meant it kept falling while Nifty 50 was already recovering. Second, the difference between -59.5% and -67.6% is psychologically enormous. An investor watching their portfolio halve is in pain. An investor watching it fall by two-thirds is typically in panic-selling territory — which is precisely when they permanently destroy their returns.
Nifty 500 at -63.7% sits between the two, and its trough aligned with Nifty 50’s (October 2008), not with NLM 250’s later bottom. The market-cap weighting of Nifty 500 — with ~58.6% in large caps — provides a natural stabiliser during market stress that NLM 250’s hard-coded 50% midcap allocation cannot.
Covid Crash
All three fell approximately 30–31% in the March 2020 crash. The ordering was maintained: NLM 250 -31.2%, Nifty 500 -30.6%, Nifty 50 -30.2%. Recovery was swift for all — within 8 months. The COVID crash, unlike 2008, was V-shaped and policy-driven, and did not significantly differentiate the three indices in terms of investor experience.
In every significant market crash, the ranking is consistent: NLM 250 falls deepest, Nifty 500 falls moderately more than Nifty 50, and Nifty 50 recovers fastest.
The 8.1% extra drawdown of NLM 250 versus Nifty 50 is not just a number — it represents real investor pain and real risk of panic-selling at the bottom.
Nifty 500’s drawdown (-63.7%) is deeper than Nifty 50 (-59.5%) but significantly shallower than NLM 250 (-67.6%). A reasonable middle ground.
An investor who sold at the 2008 bottom would have turned a paper loss into a permanent one. The deepest-falling index carries the highest risk of this behavioural failure.
Rolling CAGR Returns Across Four Time Horizons
A single point-to-point return is almost meaningless for evaluating an index — it depends entirely on when you started. Rolling return analysis solves this by computing the return for every possible start date in the dataset, showing you the full distribution of investor outcomes across different market entry points.
Each point on the rolling return chart answers: “If I had invested exactly N years before today and held patiently, what would my CAGR have been?” A value below zero means you lost money in real terms.
1 Year Rolling Returns –

The 1-year chart is extreme volatility on display. All three indices swing from roughly +90 – 115% to -52–60%. The return spread (best minus worst) is 142 percentage points for Nifty 50, 157 percentage points for Nifty 500, and 175 percentage points for NLM 250 — the widest dispersion of any index at any window. This is the cost of NLM 250’s mid-cap aggression at short holding periods.
Nifty 500 produced negative 1-year returns in 20.7% of all periods — slightly more frequently than both Nifty 50 (18.3%) and NLM 250 (18.3%). This is because Nifty 500’s broader market exposure (including small caps) amplifies downside in a way that pure large-cap concentration (Nifty 50) avoids.
At 1-year, equity investing is nearly speculation. Entry point determines almost everything.
All three indices had negative returns in ~18–21% of rolling 1-year periods. No index is “safe” at this horizon.
NLM 250 has the widest return spread (175pp) — biggest wins AND biggest losses at 1 year.
If your horizon is 1 year, equity is the wrong asset class. Full stop.
3 Years Rolling Returns –

At 3 years, the picture improves substantially. Negative CAGR periods become much rarer — but they have not disappeared. A critical finding: Nifty 500 produced negative 3-year CAGRs in 5.1% of all periods — twice as frequently as Nifty 50 (2.3%) and less frequently than NLM 250 (6.9%). The Nifty 50’s concentration in stable large caps gives it the lowest probability of a 3-year loss.
At the same time, NLM 250 begins to show its return advantage — averaging 14.5% 3-year CAGR versus Nifty 500’s 13.0% and Nifty 50’s 12.5%. But with a higher frequency of negative periods and a worse minimum (-9.4% vs -2.6%), the risk is not fully compensated at this window.
Nifty 500 beats Nifty 50 in 58% of all rolling 3-year periods — a modest but consistent edge.
Nifty 50 had the fewest negative 3-year periods (2.3%) — its large-cap stability shows up here.
NLM 250’s higher average CAGR (+14.5%) is appealing, but negative periods (6.9%) are nearly 3x Nifty 50.
Nifty 500 beats Nifty 50 in 58% of 3-year periods — a consistent but narrow outperformance.
A 3-year horizon is still too short for aggressive mid-cap exposure. Nifty 500 or Nifty 50 is more appropriate here.
5 Years Rolling Returns –

The 5-year chart is where equity investing begins to truly reward patience. The most striking finding: Nifty 50 had zero negative rolling 5-year periods in the entire 21-year dataset. Every single 5-year rolling CAGR was positive for Nifty 50. Nifty 500 had just 1.0% of periods with a negative CAGR — essentially isolated to the worst 2007–2008 entry cohort. NLM 250 was 0.5%.
At 5 years, Nifty 500 beats Nifty 50 in 52% of all periods — roughly a coin flip. NLM 250, on the other hand, beats Nifty 500 in a remarkable 97% of all rolling 5-year periods. This is where NLM 250’s structural mid-cap bias starts paying off consistently. However, it comes with a higher average standard deviation (~21.9% vs ~20.6% for Nifty 500 vs ~19.7% for Nifty 50).
At 5 years, Nifty 50 had ZERO negative rolling periods. Equity risk largely disappears at this horizon.
NLM 250 beats Nifty 500 in 97% of 5-year periods — an extraordinary finding that supports mid-cap allocation for long-term investors.
Nifty 500 and Nifty 50 are essentially tied at 5 years (52% win rate for Nifty 500). The extra 0.5% CAGR from Nifty 500 is real but slim.
If your horizon is 5+ years and you can handle moderate drawdowns, Nifty 500 is the rational choice over Nifty 50. For maximum returns, NLM 250 dominates — but at higher experienced volatility.
10 Years Rolling Returns –

The 10-year rolling chart delivers the clearest finding of this entire analysis: every single rolling 10-year period — for all three indices — was positive without exception. Zero losses across 21 years of data and hundreds of rolling 10-year periods. This is the ultimate argument for long-term equity holding: patient investors always won, regardless of which of these three indices they chose.
At the 10-year window, Nifty 500 beats Nifty 50 in 77% of all periods — significantly more consistent than at shorter horizons. And NLM 250 beats Nifty 500 in 100% of rolling 10-year periods — without exception. These are powerful data points. The question is whether the extra CAGR from NLM 250 (+1.8% over Nifty 500) is worth the additional volatility and deeper drawdowns over that decade.
All three indices: zero negative 10-year periods. Equity over 10 years has never lost in this dataset.
NLM 250 beats Nifty 500 in 100% of rolling 10-year periods — +1.8% avg CAGR advantage.
Nifty 500 beats Nifty 50 in 77% of 10-year periods — a reliable and consistent edge.
The longer the horizon, the more Nifty 500’s breadth and NLM 250’s mid-cap exposure pay off.
For a 10-year investor choosing between Nifty 50 and Nifty 500, the data is clear: Nifty 500 wins more often.
Rolling Standard Deviation –
Standard deviation of monthly returns, annualised by multiplying by the square root of 12, is the most robust measure of experienced investment volatility. This is not theoretical volatility — it is the actual month-to-month variability of returns that a real investor would have lived through during each rolling period. A higher number means your returns bounced around more violently.
1 Year Rolling Standard Deviation –

The 1-year rolling std dev chart is dominated by the 2008–09 GFC spike. NLM 250 hit over 42% annualised volatility during this period — meaning monthly returns were swinging by over + or 1 12% in a typical month. Nifty 500 peaked at ~40%, and Nifty 50 at ~38%.
Average 1-year rolling std dev: Nifty 50 18.8%, Nifty 500 19.6%, NLM 250 20.6%. The gap between Nifty 50 and NLM 250 is approximately 1.8 percentage points on average. For the return premium NLM 250 earns (+2.7% avg CAGR over Nifty 50 at 1 year), this is not compelling at this horizon — the extra risk is large relative to extra return.
2008 peak: NLM 250 ~42%, Nifty 500 ~40%, Nifty 50 ~38% — genuine crisis volatility.
Average gap NLM 250 vs Nifty 50: ~1.8pp more volatility for ~2.7pp more avg CAGR. Not compelling at 1-year.
Nifty 500 sits barely above Nifty 50 in volatility, confirming its market-cap weighting keeps it anchored.
3 Years Rolling Standard Deviation –

At 3 years, the GFC volatility spike is still visible but spread across more months. Average 3-year rolling std dev: Nifty 50 19.8%, Nifty 500 20.9%, NLM 250 22.1%. The gap between NLM 250 and Nifty 50 is now 2.3 percentage points — actually wider than at 1 year. This reveals an important truth: mid-cap volatility does not average out quickly. Extended periods of midcap underperformance (like 2018–2020) mean that 3-year std dev can be higher than 1-year std dev in some rolling windows for NLM 250.
Gap widens at 3 years: NLM 250 is 2.3pp more volatile than Nifty 50 on average.
Mid-cap volatility persists at 3 years — it does not “average out” as quickly as many investors assume.
Nifty 500 is only 1.1pp more volatile than Nifty 50 — a very modest premium for significantly broader exposure.
5 Years Rolling Standard Deviation –
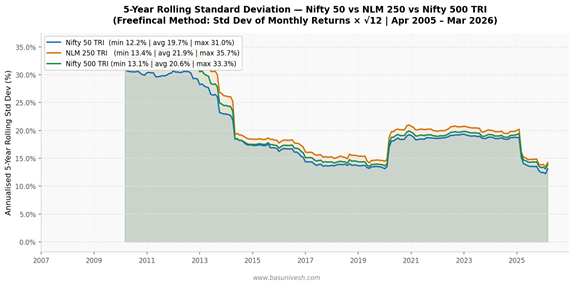
Average 5-year rolling std dev: Nifty 50 19.7%, Nifty 500 20.6%, NLM 250 21.9%. The picture at 5 years is critical for investment decision-making. Consider the risk-adjusted return comparison:
• NLM 250 vs Nifty 50: +2.1% extra CAGR, +2.2pp extra std dev – questionable Sharpe improvement
• Nifty 500 vs Nifty 50: +0.5% extra CAGR, +0.9pp extra std dev – modest but efficient improvement
• NLM 250 vs Nifty 500: +1.6% extra CAGR, +1.3pp extra std dev – reasonable risk-return at this window.
For a 5-year investor, Nifty 500 offers a better risk-adjusted premium over Nifty 50 than NLM 250 does. You gain modest breadth without taking on disproportionate volatility.
At 5 years: Nifty 500 extra std dev vs Nifty 50 = only 0.9pp. For +0.5% CAGR. Small but positive trade-off. NLM 250 extra std dev vs Nifty 50 = 2.2pp. For +2.1% CAGR. Large in both directions — high risk, high reward.
Risk-adjusted (Sharpe-like): Nifty 500 beats Nifty 50 efficiently. NLM 250 beats both in return, but requires tolerance for sustained volatility.
10 Years Rolling Standard Deviation –

The 10-year rolling std dev chart delivers the most counter-intuitive finding in this analysis. Average 10-year rolling std dev: Nifty 50 18.9%, Nifty 500 19.9%, NLM 250 21.1%. The values have converged significantly compared to the 1-year window. The difference between NLM 250 and Nifty 50 is now just 2.2 percentage points on average — for +2.3% average 10-year CAGR advantage. That is a meaningful improvement in risk-adjusted return at the 10-year horizon.
But here is the key insight for the Nifty 500 comparison: at 10 years, Nifty 500 carries only 1.0pp more std dev than Nifty 50 while delivering +0.5% more CAGR. This is an extremely efficient trade-off — almost no extra volatility for genuine extra breadth and diversification.
All three converge to 18–22% annualised std dev at 10 years — the gap narrows substantially.
NLM 250: +2.2pp more volatility than Nifty 50, but +2.3% more CAGR – improved risk-adjusted picture at 10Y.
Nifty 500: only +1.0pp more volatility than Nifty 50, and +0.5% more CAGR – highly efficient at 10Y.
At 10 years, the extra volatility in NLM 250 is real but substantially reduced. Long-term holders are rewarded.
However, you must have actually held for 10 years through ?67% drawdowns to realise this convergence.
Why is the Nifty 500 the Most Suitable Choice for Most Investors?
After examining 21 years of actual data across lump sum returns, drawdowns, rolling CAGR, and rolling volatility, we arrive at a considered view. The data supports Nifty 500 TRI as the most practically suitable index for the majority of Indian long-term investors — for the following reasons.
1. Nifty 50 Is Too Concentrated to Be Called “Diversified”
Nifty 50 covers just 55.5% of India’s listed equity market and only 50 companies. In a country with over 1,900 listed companies across 21 sectors, a 50-stock portfolio misses 44.5% of the market by value. It covers only 14 out of 21 sectors. It is heavily skewed toward Financial Services and IT — sectors which happen to be dominant today but were not always so.
The Nifty 50 is not a bad index. It is excellent for its purpose — tracking India’s largest businesses at minimal cost and tracking error. But calling it a “diversified” equity portfolio is a stretch by any reasonable definition of diversification. If you hold only Nifty 50, you have essentially bet your equity returns on 50 companies and 14 sectors.
2. NLM 250 Is Structurally Too Risky for Most Retail Investors
NLM 250 is a compelling index on paper, and the 21-year data confirms it delivers the highest returns. But three structural issues make it unsuitable as a core holding for most retail investors:
• Forced 50% midcap allocation is not natural. Market-cap weight of midcaps in India is approximately 15–18% of NSE. NLM 250 triples that to 50% by mandate. When midcaps underperform for extended periods — as they did from 2018 to 2020 — investors face prolonged, frustrating underperformance versus even the Nifty 50. This is not a short phase — mid-cap cycles can last 2–3 years.
• Higher tracking error is a practical problem. Mid-cap stocks are less liquid. Index funds tracking NLM 250 systematically suffer higher tracking error compared to Nifty 50 or even Nifty 500 funds, due to impact costs in the mid-cap segment. The returns you see in the index are not fully deliverable in a fund.
• The drawdown depth tests real behavioural limits. A -67.6% peak-to-trough fall is not a statistic most investors have genuinely internalised. In practice, an investor watching Rs.10 lakhs become Rs.3.24 lakhs will sell — and at that point, all the theoretical 15.17% CAGR becomes irrelevant. The index’s historical return is only realisable by investors who held through every crash without selling.
3. Nifty 500 Is the Rational Sweet Spot — Here Is Why
Nifty 500 resolves all three problems above in a single index:
• True diversification: 92.3% of NSE free-float market cap, 500 companies, all 21 sectors. This is as close to “owning the Indian economy” as a single index gets.
• Market-cap-weighted and naturally rebalanced: Unlike NLM 250’s forced 50% midcap mandate, Nifty 500’s mid-cap weight (~18.5%) reflects actual market proportions. When midcaps correct, the weight naturally reduces — built-in risk management without any active decision.
• Lower drawdown than NLM 250 with better diversification than Nifty 50: At -63.7% versus NLM 250’s -67.6%, Nifty 500 avoids the worst of the mid-cap panic without sacrificing breadth. And at -63.7% versus Nifty 50’s -59.5%, the extra pain is modest for substantially wider coverage.
• Beats Nifty 50 in 77% of 10-year rolling periods: This is not marginal or unreliable. Over every decade-long window in the dataset, Nifty 500 outperformed Nifty 50 in nearly four out of five instances. The extra return from broader market participation is real and consistent.
• Efficient risk-return at all horizons: At 10 years, Nifty 500 delivers +0.5% extra CAGR versus Nifty 50 for +1.0pp extra std dev. This is an extremely efficient trade-off — almost no extra volatility for genuine extra breadth and return.
• Lower structural tracking error risk than NLM 250: Nifty 500’s larger-cap bias within its 500 stocks means index fund managers face lower impact costs and tighter tracking. The index return is more closely achievable in practice than NLM 250’s.
92.3% market coverage vs 55.5% (Nifty 50) and ~87% (NLM 250) — broadest and most representative. Beats Nifty 50 in 58%, 52%, and 77% of rolling 3Y, 5Y, and 10Y periods respectively — consistent edge.
Max drawdown of -63.7% vs Nifty 50 (-59.5%) — only 4.2% extra pain for massively wider coverage.
Market-cap weighted: midcap exposure (~18.5%) is proportional and self-adjusting — no forced structural bets. Risk-adjusted at 10 years: +0.5% CAGR for +1.0pp std dev versus Nifty 50. Highly efficient.
Avoids NLM 250’s 50% forced midcap allocation, higher tracking error, and deeper drawdowns.
For most SIP investors with a 10-15 year horizon, Nifty 500 is the right one-fund equity solution.
The data from 21 years of actual NSE TRI values is clear. All three indices are good investments over a sufficiently long horizon — the question is which suits your specific situation.
Nifty 50 is not “wrong” — it is India’s most proven large-cap benchmark with the lowest tracking error and fastest recovery from crashes. But choosing Nifty 50 means accepting significant concentration risk in a 50-stock, 14-sector, 55.5%-market-coverage portfolio.
NLM 250’s 15.17% CAGR is real and meaningful — Rs.19.41 lakhs versus Rs.14.29 lakhs for Nifty 50 over 21 years. But most investors who claim they will hold through a 67% drawdown will not actually do so when they are living through it. And the forced 50% midcap mandate introduces extended underperformance cycles that are psychologically difficult even for experienced investors.
Nifty 500 is the pragmatic, data-backed sweet spot: 92.3% market coverage, market-cap-weighted natural allocation, beats Nifty 50 in 77% of 10-year rolling periods, avoids NLM 250’s structural mid-cap concentration, and keeps tracking error at manageable levels. For most Indian investors building long-term wealth through SIPs or lump sum investments, a Nifty 500 index fund is the single most rational core equity holding.
The Most Important Lesson: Behaviour Beats Index Selection
All three indices multiplied Rs.1 lakh into Rs.14–19 lakhs over 21 years. The winner was patience.
An investor who sold during the 2008 crash (-60 to -67%) and waited for clarity earned a fraction of these returns.
The best index for you is not the one with the highest back tested CAGR — it is the one you will HOLD during the next major crash without selling.
If you cannot confidently hold an index through a 60%+ drawdown, do not buy that index regardless of its historical returns.
Time in market > timing the market > index selection. The data, spanning two major crashes and 21 years, is unambiguous.

Dear sir please comment full name of nifty 500 index fund to invest.
Dear Yogesh,
There are few like Motilal Oswal and SBI.
Hello BasuNivesh Ji,
I have choose one mid-cap & one Small cap but confuse with 3rd should be large cap, flexi cap or Value Oriented MF, could you please suggest me with the 3rd MF for time frame of investment is more than 10 plus years (Goal: Child Education). Already planned debt basket (currently ongoing EPF+PPF+NPS ) & rest emergency fund, Term & Health Ins.
No changes in the 1st & 2nd MF
1) Bandhan Small Cap Fund – Small Cap
2) Nippon India Growth Mid Cap Fund
Confused for 3rd one which one should be included
3) Nippon India Large Cap Fund
or
flexi cap
or
DSP Value Fund/ICICI Pru Value Dir (Value Oriented)
Mode of investment will be SIP
% of allocation will be 40% in the 3rd Fund, 35% Midcap, 25% smallcap
Please suggest
Dear Nitin,
One Nifty 50 Index Fund enough to fill the gap of large cap.
Thank you for replying BasuNivesh Ji, any suggestion on Nifty 50 Index Fund
Thanks in advance
Hello Sir,
Could you please share your thoughts wrt to factor based index funds, & this performance over simple & boring index funds.?
Dear Manas,
Suchd funds are DISGUISED active funds. Avoid all such gimmicks and try to own the whole market through a simple Index Fund.
Thank you sir, for continued guidance
Hello Basu sir, I have been visiting your blog from time to time and consider the wisdom and curated content on this blog to be very balanced, not scare-mongering and genuinely helpful. I am not even that easy to impress when it comes to money matters. Thanks for taking time to post, despite having a busy consultation business.
Here is one thought on the current article – if risk is involved and returns are the rewards for said risk, between 55% drawdown and 65% drawdown, is there much to loose (considering 55% is imminent), but returns over time are better for Nifty 250. Please continue your good work sir. There is a dearth of good consultants these days.
Dear Sumanth,
Thanks for your kind words. Taking higher risk does not by default deliver into rewards and rewards are not guaranteed too.
Yes, its probably hind-sight bias that caused the idea. Without the data in hand it would not be possible. Its far wiser to stay guarded and safe than sorry.
How are you able to stay so neutral Basu sir. Is it because its your job or is it because you have spent time looking at lots of data points? Really curious now…
Dear Sumanth,
Yes, I agree. Regarding my neutral views, when it comes to money matters, don’t trust anyone (including me too). End of the day it is our money which is at risk. Hence, being neutral and looking at pros and cons is the way forward to be a informed investor. It comes by habit.
Very well written piece Basu. Could you consider adding Nifty 500 Multicap 50:25:25 to the comparison mix please? While it lacks vintage like the N50, with frequent rebalancing to keep the limits, it might give slightly better back tested returns to the Nifty 500/50/NN50.
Dear Prasanna,
Sure and let me do it.
Thank you so much, looking forward to your analysis! At this time, SC250 valuations are lower than LT median. With a separate SC index strategy, profit booking onus falls on investor to preserve gains. With NMC500 (50,25,25), quarterly resets allow auto profit booking without CG incidence (pass thro vehicle).
Dear Prasanna,
To keep it simple and chasing valuation and momentum, I prefer owning the whole market.
by any chance have you had a chance to model how nifty multicap 500 (50:25:25) fares vs the other 3 indices you have compared earlier? Thank you
Dear Prasanna,
Let me do it in a separate article.
Dear Basu, Have you had a chance to analyze the N500 with Nifty Multicap 500 (50:25:25) please? Thanks you
Dear Prasanna,
Thanks for reminder. I will do soon.
So, NLM250TRI should be the best choice from long term wealth creation point of view.
Dear Kamal,
Yes, but bit risky than Nifty 50 and Nifty 500. However, if you are comfortable with risk, then go ahead.
Thank you for the detailed analysis Basu!
Other than the main topic it is clearly evident that long term investing actually works.
Dear Sunil,
My pleasure 🙂
Basu
Thanks for the post. I am currently investing only one equity fund Nifty 50 Index fund which is 50% of my overall portfolio. Do i need to switch Nifty 500.
Dear Devan,
No need to change. Just stick to it.
Basu, My entire equity portion is with Single Nifty index fund, which is close to 56% of my portfolio. Can i add NN50 index fund like N50:NN50 75%:25%. Instead of midcap fund, will NN50 compensate the portfolio with diversification instead of single fund.
Dear Devan,
If you feel it is too much concentrated, then adding one more fund of same category is better than adding another category. Also, do remember that Nifty Next 50 is highly volatile like Nifty Midcap.
Tracking error is higher in in N500 vs N50. How does it affect above analysis?
Dear Dipak,
As the majority of Nifty 500 Index Funds are to certain extent new, you might have noticed certain high tracking error funds. But there are few within this fund category that are with low tracking error and tracking difference. That one you can choose.