Nowadays we are receiving so many social media images or messages about the journey of gold from 1925 to 2020. The gold price of Rs.18.75 in 1925 to Rs.47000 in 2020. Considering this phenomenal growth, should we consider to invest in gold?
Define first whether gold is an investment or commodity
Before jumping into the price movement, you have to first decide whether you are buying gold for investment or for your own usage (as a commodity). Do remember that when you are buying gold for your own usage, then there is no point in tracking the gold price or returns. Because at the end it is your usage purpose and if the gold price jumps to Rs.60,000, then you will not sell it.
Hence, understanding this difference while buying gold is very much important. Majority of us buying gold for our own usage but thinking that it is an investment. However, when you buy the gold for your own usage, then you have to incur the cost of making charges and wastage. Also, the gold ornament you purchased today may be outdated after a few years. Hence, again you have to spend on making charges. One more disadvantage of gold if you buy in physical format is the cost and risk of safekeeping.
Considering all these aspects, it is very much important for you to decide the reasons for your buying the gold.
Gold Price of Rs.18.75 in 1925 to Rs.47000 in 2020 – Should you invest?
As I mentioned above, there are few jewelry shop owners who are spreading this news item in social media by comparing the gold price of Rs.18.75 in 1925 to Rs.47000 in 2020. I am not questioning the price movement. If we plot the gold price of Rs.18.75 in 1925 to Rs.47000 in 2020, then it looks like below.

However, the question here is how many of us invested in 1925 and hold it up to 2020? Few of us may be holding it in its original form considering the asset as ancestors. But the % of such people is very rare. Even if we assume that someone is holding the gold from 1925 to 2020, then the CAGR is just 8.58% (excluding the holding charges, making charges, wastage, or the taxation of gold).
Hence, to understand the actual price movement and how highly volatile is gold as an asset class, let us consider the concept of ROLLING RETURN.
Let me explain to you in simple terms of what is rolling return. As you may be aware that this post is considering the gold price of Rs.18.75 in 1925 to Rs.47000 in 2020, then what is a 1-year rolling return? It means someone buying the gold in 1925 and selling it in 1926 and continue to do like buying in 1926 and selling in 1927 up to the period of buying in 2019 and selling in 2020. In such a one year holding period, what are the probability of returns? Let us see the same by plotting a 1-year rolling return chart.
Rather than just considering the price movement of the last 95 years, if we plot such rolling returns, then we actually can understand the volatility of the gold price.
# 1 Yr Rolling Returns of Gold from 1925 to 2020

Look at the price movement of gold for a 1-year rolling return from 1925 to 2020. It varies from the highest one year return of up to 40% and negative returns of almost 30% also.
The standard deviation (variation of returns with respect to average) is almost 12.8%.
If we plot the histogram chart, then it looks like below.

The above graph shows that are around 4 instances where the investors faced -29% to -20% returns, 2 instances of -20% to -10% returns, 14 instances of -10% returns to 0%, 39 instances of 0% to 9% returns, 22 instances of 9% to 19% returns, 9 instances of 19% to 29% returns, 4 instances of 28% to 38% returns and only one instance where an investor received more than 38%.
This will clearly shows the wide movement of gold price during this 1925 to 2020.
# 3 Yrs Rolling Returns of Gold from 1925 to 2020
Let us move to 3 years rolling returns. As I said above, 3 years rolling returns means someone buys gold in 1925 and sells it in 1928, and those who buy gold in 1926 will sell it in 1929 and continue buying the gold in 2017 and selling in 2020. Hence, here the holding period is 3 years. In such a scenario, how the movement looks?

Here also if you look at the return variation, then you noticed that the highest returns are around 40% but the lowest return is more than -15% !!
The standard deviation (variation of returns with respect to average) is almost 11.13%.
If we plot the histogram chart, then it looks like below.

The above graph shows that there are around 4 instances where the returns were between -15% to -7%, 17 instances where the returns were between -7% to 1.5%, 36 instances where the returns were between 1.5% to 10%, 20 instances where the returns were between 10% to 18%, 7 instances where the returns were between 18% to 27%, 5 instances where the returns were 27% to 35% and 4 instances where the returns were between 35% to 44% if you are holding the gold for 3 years during this 1925 to 2020 period.
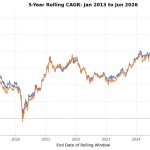
# 5 Yrs Rolling Returns of Gold from 1925 to 2020
Now let us move on to an investor who is willing to hold the gold for 5 years. It means if someone buys the gold in 1925 then he will sell it in 1930 and if someone buys it in 1926, then he will sell it in 1931 and so on up to a buyer who buys it in 2015 and selling in 2020.
This is how the graph looks like.

Here also you noticed that the return varies for someone to as high as almost 35% to the negative return of almost -10%
The standard deviation (variation of returns with respect to average) is almost 8.5%
If we plot the histogram chart, then it looks like below.

If you notice the above graph, then you realize the widespread returns like 8 instances where the returns were between -8.5% to -1.9%, 21 instances where the returns were between -1.9% to 4.7%, 30 instances where the returns were between 4.7% 11.3%, 17 instances where the returns were between 11.3% to 17.9%, 12 instances where the returns were between 17.9% to 24.5%, 2 instances where the returns were between 24.5% to 31% and only one instance where the returns were more than 31%.
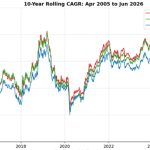
# 10 Yrs Rolling Returns of Gold from 1925 to 2020
Let us now consider an investor who is buying the gold in 1925 and selling it in 1935 like that if someone buys it in 1926 will sell in 1936 and will continue up to buying in 2010 and selling in 2020. In such a situation how the returns were spread?

Here, you noticed that the returns hover between highest of 25% to lowest of around zero to less than that.
However, the standard deviation (variation of returns with respect to average) is almost 6.42%.
If we plot the histogram chart, then it looks like below.

If you noticed, there were around 22 instances where the returns were between -1% to 4%, 27 instances where the returns were between 4% to 9%, 17 instances where the returns were 9% to 14%, 13 instances where the returns were between 14$ to 19%, 6 instances where the returns were 19% to 24% and only one instance where the return was more than 25%.
# 20 Yrs Rolling Returns of Gold from 1925 to 2020
Let us now consider the rolling returns of 20 years. It means someone investing in gold in 1925 will sell it in 1945 if someone invests in 1926 will sell it in 1936 and up to the period of someone buying the gold in 2000 and selling it in 2020. In such a situation how the returns vary.

You noticed that if someone is holding more than 20 years, then they have not faced any negative returns. Also, the highest return they generated was around 17%.
However, the standard deviation (variation of returns with respect to average) is almost 4.35%.
If we plot the histogram chart, then it looks like below.

Here also you noticed the widespread returns. There are around 9 instances where the returns were between zero to 3.6%, 22 times where the returns were between 3.6% to 7%, 23 instances where the returns were around 7% to 10%, 10 instances where the returns were between 10% to 14%, 11 instances where the returns were between 14% to 18% and only one instance where the return was more than 18%.
Conclusion:-You noticed that if you are investing in Gold for more than 20 years, then only you can expect a positive return. If your investment period is 10 years or less than that then be ready for expecting some negative returns. Volatility (standard deviation) will decrease as you invest for the long term. However, at the same time, if you increase your investment period, the return expectation will decrease (for example in case of 10 years rolling returns, the highest return is 24% but if your holding period is 20 years, then the returns reduced to less than 20%.
I have not considered the cost of holding the gold (either in physical or in any other form) and if your investment is in gold ornaments then I have not considered the making charges or wastage expenses and these are pre-tax returns.
Hence, considering all these aspects, one can come to the conclusion that even though the journey of the Gold Price of Rs.18.75 in 1925 to Rs.47000 in 2020 looks fabulous, there are many UPS and DOWNS and also the RISK of holding such assets. Don’t go by the stories shared by these jewelry shops but do the calculation on your own and invest.
IN GOLD, SHORTER THE HOLDING PERIOD, HIGHER THE RISK AND PROBABILITY OF HIGH LOSS/PROFIT. LONGER THE HOLDING PERIOD, LOWER THE RISK BUT RETURNS ARE ALSO LESS.
Read our lastest posts:-
- EPF Scheme 2026: EPF, EPS and EDLI Rules Explained Fully

- Financial Freedom Without Health? You’ll Regret It Later

- The Peltzman Effect: Why Playing It Safe Can Make You Poor

- Your Retirement Success Depends on Luck, Not Skill

- Never Compare Nifty 50 Index Funds Vs Active Large Cap Funds!
- Nifty 500 Multicap 50:25:25 vs Nifty 500: Which Is Best?
Sir how about investing in reits in India…if at all … the best one… please….
Dear Bimal,
They are not different than the typical real estate. Better to avoid.
Nice article.
How much %age would you recommend to invest in gold from an investment purpose for money growth.
Dear Abhijit,
With the kind of volatility, do you feel it is worth considering in your portfolio?
Excellent Article Sir
Dear Anand,
Pleasure.
For retail investor, Do we need Gold, International funds in the portfolio along with
Equity and Debt. There is not clear meaning of Diversification. Most of blogs/Planners suggest for diversification , we need to have different asset classes like Equity,Debt,Gold,International funds.
Dear Kalai,
As per me, I least bother about Gold as an asset class and fancy products called INTERNATIONAL FUNDS.