Most planners blindly quote SPIVA India to dismiss active funds. But the report uses wrong benchmarks and changed them mid-history. Here is the real truth.
If you are a regular reader of my blog, you already know that I have been recommending index funds for several years now. I have written at length about why most active fund managers fail to consistently beat the market, and why a simple, low-cost index fund portfolio is the most sensible approach for the majority of Indian investors.
But today I want to raise a different kind of question. Not whether active funds beat passive funds – but whether the most widely cited report used to answer that question in India is even measuring the right thing.
I am referring to the SPIVA India Scorecard, published by S&P Dow Jones Indices. Financial planners, wealth managers, bloggers, and even SEBI-registered investment advisers regularly use this report to tell their clients that active funds consistently underperform. The headline number – that 70%, 80%, or even 90% of active funds underperformed their benchmark over a given period – gets repeated so often that it has become almost an article of faith in Indian personal finance circles.
However, when you look closely at which benchmark SPIVA is actually using to compare each fund category, a serious problem emerges. And this problem has gotten significantly worse from mid-2024 onwards, for a very specific reason that very few people have discussed.
The question is not just whether active funds beat passive funds. The more important question is: is SPIVA India using the correct benchmark to make that comparison?
Active vs Passive – Why You Must Not Trust SPIVA India Report?
SPIVA stands for S&P Indices Versus Active. It is a global series of scorecards published by S&P Dow Jones Indices that compares actively managed mutual funds against relevant benchmark indices across different countries including the United States, Europe, Japan, Australia, and India.
The SPIVA India Scorecard specifically evaluates Indian equity mutual funds across categories such as Large-Cap, Mid-/Small-Cap, and ELSS (Equity Linked Savings Scheme). It tells us what percentage of actively managed funds in each category failed to beat their respective benchmark index over 1-year, 3-year, 5-year, and 10-year periods.
One genuinely good thing about SPIVA is that it adjusts for survivorship bias. It includes funds that were merged or wound up during the measurement period, which prevents the data from showing only the surviving funds (which tend to be the better performers). This is a methodological strength, and I want to give credit where it is due.
The report is published twice a year – once in March or April covering December year-end data, and once around September or October covering mid-year June data. I will come back to this six-monthly cadence and why it has its own limitations.
So far, so good. But the entire value of this analysis depends critically on one thing: whether the benchmark being used for comparison is actually the right one for each category of funds. And that is exactly where the problem lies.
First, Let Us Understand SEBI’s Fund Categorization
Before we examine the benchmarks SPIVA uses, it is important to understand how SEBI has defined mutual fund categories in India.
In October 2017, SEBI issued a landmark circular on the categorization and rationalization of mutual fund schemes. This circular brought in uniformity and clarity to what had previously been a confusing and inconsistent system where different fund houses used different names for similar types of funds.
SEBI defined the three market cap tiers as follows:
Large-Cap companies: Ranked 1st to 100th by full market capitalization (as per the AMFI list updated every six months)
Mid-Cap companies: Ranked 101st to 250th by full market capitalization
Small-Cap companies: Ranked 251st onwards by full market capitalization
Based on these definitions, SEBI mandated the following investment requirements for each category:
Large-Cap Fund: Must invest at least 80% of its total assets in large-cap stocks, i.e., the top 100 companies by market cap.
Mid-Cap Fund: Must invest at least 65% of its total assets in mid-cap stocks, i.e., companies ranked 101 to 250.
Small-Cap Fund: Must invest at least 65% of its total assets in small-cap stocks, i.e., companies ranked 251 and beyond.
ELSS Fund: Must invest at least 80% of its total assets in equity and equity-related instruments as per the ELSS 2005 notification. There is no cap-tier restriction.
Keep these SEBI definitions firmly in mind. They are the foundation of everything that follows.
The Benchmark History: What SPIVA Used Before and After 2024
Here is something that most people citing SPIVA data do not know: the benchmark indices used in the SPIVA India Scorecard were changed in mid-2024. Before and after this change, the report uses fundamentally different benchmarks.
Until the mid-2024 report, SPIVA India used benchmarks from the S&P BSE index family, which were maintained by Asia Index Private Limited (AIPL) – the joint venture between S&P Dow Jones Indices and BSE Limited, set up in 2013.
| Fund Category | Benchmark Used (Before Mid-2024) | Appropriateness |
| Large-Cap Funds | S&P BSE 100 (top 100 companies by market cap) | Reasonable – matches SEBI’s top-100 mandate for large-cap funds |
| Mid-/Small-Cap Funds | S&P BSE 400 MidSmallCap Index | Partially appropriate – covers mid and small cap together but SEBI treats them as separate categories |
| ELSS Funds | S&P BSE 200 (top 200 companies) | Broadly acceptable given ELSS has no cap-tier restriction |
Of these, the large-cap benchmark – the S&P BSE 100 – was actually reasonably appropriate. It covered exactly the top 100 companies that large-cap funds are mandated to invest in. A financial planner using pre-2024 SPIVA data for large-cap funds was at least working with a benchmark that matched the fund mandate.
From Mid-2024 Onwards: The New S&P India Benchmarks
From the mid-year 2024 report (covering data through June 2024) onwards, SPIVA India switched to a new set of benchmarks under the S&P India index family, maintained independently by S&P Dow Jones Indices. The BSE indices were dropped entirely.
| Fund Category | Benchmark Used (From Mid-2024) | Appropriateness |
| Large-Cap Funds | S&P India LargeMidCap Index (~top 200 companies) | WRONG – covers top 200 companies, while large-cap funds are mandated to invest in only the top 100 |
| Mid-/Small-Cap Funds | S&P India SmallCap Index | WRONG – benchmarks a combined mid+small category against a pure small-cap index |
| ELSS Funds | S&P India BMI (broad market index) | More defensible, but risk mismatch possible if fund tilts toward smaller caps |
The switch from S&P BSE 100 to S&P India LargeMidCap as the large-cap benchmark is the single biggest methodological flaw in the current SPIVA India Scorecard. It changed a reasonably appropriate comparison into a fundamentally incorrect one – almost overnight.
Why Did SPIVA Switch Away from BSE Indices in 2024?
This is the part that most personal finance commentators have completely missed, and it is important context for understanding why the benchmark change happened.
S&P Dow Jones Indices and BSE Limited had operated a joint venture called Asia Index Private Limited (AIPL) since 2013. AIPL was the entity that maintained and published the S&P BSE indices – including the widely tracked Sensex, BSE 100, BSE 200, BSE 400, and so on. Passive funds with nearly Rs 2 trillion in assets were benchmarked to indices maintained by this joint venture.
In May 2024, BSE announced that it had agreed to buy out S&P Dow Jones Indices’ entire 50% stake in AIPL for Rs 30 crore. The transaction was completed on May 31, 2024, after which the joint venture was formally dissolved. AIPL became a wholly owned subsidiary of BSE. S&P Dow Jones Indices exited the Indian index business entirely.
As a direct consequence of this exit, S&P Dow Jones Indices could no longer use the S&P BSE index family in its own products and publications, including the SPIVA India Scorecard. So it replaced those benchmarks with its own independently maintained S&P India index family, which it had been developing separately.
Note: This is a verified development confirmed by BSE’s exchange filing and S&P Dow Jones Indices’ own press release dated May 31, 2024. The benchmark change in SPIVA India was not a pure methodological choice – it was a structural consequence of the dissolution of the BSE joint venture.
This context matters enormously. The benchmark change was not the result of a considered decision that the new S&P India indices were more appropriate comparators for Indian mutual funds. It happened because S&P could no longer use BSE indices. The appropriateness of the new benchmarks appears to be a secondary consideration.
Breaking Down the Benchmark Flaws One by One
Flaw 1: Large-Cap Funds Compared to a Large+Mid Cap Index
This is the most serious and most impactful flaw in the current SPIVA India Scorecard.
SEBI mandates that a large-cap fund must invest at least 80% of its assets in the top 100 companies by market capitalization. The entire purpose of the large-cap category is to provide investors with exposure to India’s biggest, most stable, and most liquid companies – the likes of Reliance Industries, HDFC Bank, Infosys, TCS, and similar blue-chip names.
The S&P India LargeMidCap Index, however, covers approximately the top 200 companies. It includes the top 100 large-cap names as well as the next 100 mid-cap companies (ranked 101 to 200). This is a fundamentally different index with a fundamentally different risk and return profile.
Why does this create a problem? Because mid-cap stocks in India have, over many market cycles, delivered meaningfully higher returns than large-cap stocks. The Nifty Midcap 150 has outperformed the Nifty 50 across multiple rolling periods. When you blend these mid-cap returns into the benchmark, you create a composite index that is harder to beat than the large-cap universe that the fund manager is actually operating in.
A large-cap fund manager is constrained by SEBI to stay within the top 100 stocks. The benchmark against which SPIVA is measuring that manager includes 100 additional mid-cap stocks that the manager cannot significantly hold. This is not a minor technical mismatch. It systematically and unfairly inflates the underperformance of large-cap active funds in the post-2024 SPIVA data.
Imagine asking a person to run a 100-metre race and then declaring them the loser because they did not finish a 200-metre track in the same time. That is precisely what SPIVA India is doing with large-cap funds from mid-2024 onwards.
Flaw 2: Mid-/Small-Cap Funds Compared to a Pure Small-Cap Index
The mid-/small-cap category in SPIVA India groups together both SEBI-defined mid-cap funds and small-cap funds into a single combined category. This is already a simplification – SEBI treats these as two distinct fund categories with different investment mandates.
But the more significant problem is the benchmark chosen: the S&P India SmallCap Index, which primarily captures companies ranked 251 and beyond by market capitalization – the pure small-cap universe.
A mid-cap fund that is required to invest 65% of its assets in companies ranked 101 to 250 is being measured against an index of companies ranked 251 and beyond. These are entirely different companies with different return profiles and different levels of risk. Using a pure small-cap index as the benchmark for a combined mid+small category creates another systematic mismatch that distorts the conclusions.
Flaw 3: The Historical Discontinuity in 10-Year Data
Perhaps the most underappreciated problem with the current SPIVA India Scorecard is what the benchmark change does to long-term historical data.
The SPIVA report presents 10-year performance comparisons. But the current report uses S&P India indices from mid-2024 onwards and S&P BSE indices for all the years before that. This means the 10-year return comparison you see in the report is not a continuous, consistent comparison against the same benchmark.
For large-cap funds, the earlier years were measured against the S&P BSE 100 (top 100 companies – appropriate), while the most recent period is measured against the S&P India LargeMidCap (top 200 companies – inappropriate). These are then combined into a single 10-year figure as if nothing changed.
This is a serious methodological problem. You cannot draw reliable conclusions from a 10-year active vs. passive comparison when the benchmark itself has changed halfway through. The reported long-term underperformance figures are now a blended result of two different comparisons made against two different benchmarks.
Flaw 4: The Benchmarks Are Not Investable in India
The fundamental practical argument for passive investing is straightforward: if active funds underperform their benchmark, you should simply invest in a low-cost index fund that tracks that benchmark instead. It is compelling logic – but only if the benchmark is actually available as an investable product.
The S&P India LargeMidCap Index and the S&P India SmallCap Index are not tracked by any widely available, low-cost index fund or ETF in India. There is no retail product in the Indian mutual fund market that a saver can walk up and invest in to capture the S&P India LargeMidCap return.
In contrast, the Nifty 50, Nifty 100, Nifty Midcap 150, Nifty Smallcap 250, and BSE 500 are all tracked by multiple index funds from reputable AMCs, available in direct plans with expense ratios as low as 0.05% to 0.20%.
When SPIVA tells you that 85% of large-cap active funds underperformed their benchmark, but that benchmark is a non-investable index, the conclusion becomes practically useless for an investor trying to decide whether to switch to a passive fund. You should be comparing active funds to the actual passive alternatives available in the market.
What Is the Right Benchmark for Each Category?
If SPIVA India were to use benchmarks that are both methodologically sound (matching the SEBI mandate for each category) and practically relevant (investable for Indian investors), here is what an appropriate comparison should look like:
| Fund Category | SPIVA Uses (Post Mid-2024) | More Appropriate Benchmark | Why |
| Large-Cap Funds | S&P India LargeMidCap (~top 200) | Nifty 100 TRI or BSE 100 TRI | Covers the top 100 companies that large-cap funds must invest in per SEBI mandate |
| Mid-Cap Funds | S&P India SmallCap (grouped with small-cap) | Nifty Midcap 150 TRI | Directly tracks the 101–250 universe where mid-cap funds invest |
| Small-Cap Funds | S&P India SmallCap (grouped with mid-cap) | Nifty Smallcap 250 TRI | Tracks the 251+ universe where small-cap funds invest |
| ELSS Funds | S&P India BMI (broad market) | Nifty 500 TRI or BSE 500 TRI | Broad market is acceptable; Nifty 500 / BSE 500 are investable alternatives for ELSS |
Note: TRI = Total Return Index, which includes dividends reinvested. It is essential to compare active funds against the TRI version of any index, not just the price return version. Most SPIVA comparisons use TRI, but this distinction matters when making your own independent comparisons.
Does This Mean Active Funds Are Performing Well?
I want to be very direct and honest on this point, because I know some readers may feel I am making a case for active funds. I am not.
The structural challenges for active large-cap fund managers in India are real. The Indian large-cap market has become increasingly efficient over time. The cost disadvantage of active funds – typically 1.0% to 1.5% per year in expense ratio for regular plans and 0.5% to 0.8% even for direct plans – is a compounding headwind. The evidence from correctly benchmarked comparisons still shows that a meaningful majority of large-cap active funds have failed to beat the Nifty 100 or BSE 100 over extended periods.
What I am saying is something more specific: the numbers being reported in the SPIVA India Scorecard post-2024 are not an accurate or reliable measure of how active funds have performed against their actual investment universe. The benchmarks are wrong, and because the benchmarks are wrong, the reported underperformance percentage is inflated.
There is a difference between saying “most large-cap active funds underperform the Nifty 100” and saying “most large-cap active funds underperform the S&P India LargeMidCap which includes 100 mid-cap stocks they are not mandated to hold.” The first is a reasonably fair comparison. The second is not.
Be honest about data. A correct benchmark with a lower underperformance number is more credible than an incorrect benchmark with a higher one. The goal is accuracy, not a more dramatic headline.
A Note on the Six-Monthly Publication Cycle
Before I close, let me also briefly address the semi-annual publication cadence of SPIVA India.
Publishing twice a year is certainly better than once a year. However, markets in India can move dramatically within a six-month window. A report measuring performance through the end of a period that saw a sharp rally in mid-cap stocks will mechanically show higher active fund underperformance – because the new large-cap benchmark (S&P India LargeMidCap) would have captured those mid-cap gains while large-cap funds were constrained to hold only large-cap stocks.
Financial planners who pick up the SPIVA report every six months and quote the headline number to clients should be aware of this. A snapshot comparison is useful context, but rolling return analysis over consistent 3-year and 5-year periods against investable benchmarks will always give you a more reliable picture.
What Should You, as Investors, Actually Use Instead?
If you are a financial planner or a serious investor trying to evaluate the active versus passive question in the Indian context, here are more reliable approaches than simply citing the SPIVA India headline number.
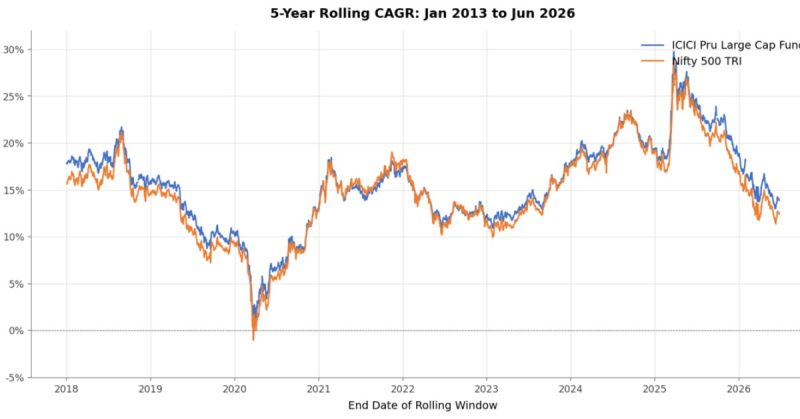
1. Use rolling return comparisons against investable indices: Compare large-cap funds against the Nifty 100 TRI or BSE 100 TRI over rolling 3-year and 5-year periods. This eliminates start-date and end-date bias and gives a more honest picture of consistency.
2. Evaluate mid-cap and small-cap funds separately: Compare mid-cap funds against the Nifty Midcap 150 TRI and small-cap funds against the Nifty Smallcap 250 TRI. Do not mix these two categories together.
3. Always use the Total Return Index (TRI): Comparing against a price-return index understates the benchmark return by roughly 1% to 1.5% per year (the dividend component). Always insist on TRI comparisons.
4. Factor in cost explicitly: Even a fund that barely beats the index on gross returns may underperform on a net-of-cost basis. A direct plan Nifty 100 index fund at 0.10% to 0.20% TER is a very difficult benchmark to beat consistently after all fees.
5. Give SPIVA credit for survivorship bias adjustment: One area where SPIVA does better than simple category averages is that it includes merged and wound-up funds in its analysis. This is a genuine methodological strength. The flaw is in the benchmark choice, not in the survivorship bias adjustment.
Conclusion –
I have been recommending index funds to my clients and readers for several years. That position has not changed. For the large-cap portion of a portfolio especially, the case for index investing in India is strong – even when you use a correctly matched benchmark.
But intellectual honesty is non-negotiable. If you are going to use data to support an argument, the data has to be measuring the right thing. The SPIVA India Scorecard, particularly from mid-2024 onwards, is not measuring the right thing for large-cap funds. The benchmark is wrong. The historical series is discontinuous. The benchmarks are not products that investors can actually buy.
The next time you see a financial planner or a personal finance influencer cite the SPIVA India report and say something like “over 80% of active large-cap funds underperformed the index,” I want you to ask two simple questions:
“Which index? Is it the top-100 index that large-cap funds are mandated to invest in, or a top-200 index that includes mid-cap stocks? And can I actually invest in that index?”
Those two questions will reveal a great deal about whether the person citing the data actually understands what they are quoting.
The broader conclusion – that passive investing with low-cost index funds is a sound long-term strategy for most Indian investors – remains valid. But the specific numbers from SPIVA India should be used with caution, context, and a clear understanding of which benchmark is being used and why.
Disclaimer – This article is for educational and informational purposes only. Nothing here constitutes investment advice or a recommendation to buy or sell any security or mutual fund. Please consult a SEBI-registered fee-only financial planner before making any investment decisions.
This article is a methodological critique based entirely on publicly available data from SPIVA India’s own published scorecards and SEBI’s own circulars. It is not a claim of any wrongdoing by S&P Global or S&P Dow Jones Indices.
To me, comparing Index funds with active funds may not be required.
Index funds can not protect the downside and hence are generally more volatile than Active funds (At least in most of the cases).
Whereas Active funds may or may not outperform the Index funds, but have the potential to protect the downside.
Returns are always in the hindsight and the risk is in the journey.
It is up to an individual investor to take a call.
Dear Ganesh,
I think this story is planted by some MFDs or AMCs to crate their income 🙂 If the active funds are successfull in creating a downside protection, then they MUST always outperform the index 🙂
Hello Basu,
Can you please share top10 mutual fund for this year.
Thanks
Dear Abhee,
Sorry for the delay. I will share soon.
It is horrendous to say the least.
Dear Kamal,
True and most importantly financial experts believe such reports BLINDLY.