How Much Returns to Expect from Nifty 50? Let us try to get the answer to this question by looking at the Nifty 50 TRI data from 1999 to 2023 (24 years).
Recently Mint published an article where they mentioned the returns possibilities as below.

However, I am unsure of whether they considered the divided income also. Hence, in this article, by considering the divided income reinvested option (Toral Return Index), let us try to understand the possible returns investors generated from the 1999 to 2023 period.
The TRI data is available from 1999 and hence I have taken it from there. For our study, we have around 6,029 daily data points.
One more clarity does not emerge from the above image. When they say more than 8% returns, then whether it is 8% to 10% or more than 8%. Instead, I thought to study the return possibilities for various periods like 1 year, 3 years, 5 years, and 10 years. Also, rather than having a plain three categories of what Mint published, I have segregated the returns data into less than 0%, 0% to 8%, 8% to 10%, 10% to 12%, 12% to 15%, and above the 15%. This I think will give us a clear picture.
How Much Returns to Expect from Nifty 50?
To understand the volatility, let us try to understand the drawdown of the Nifty from 1999 to 2023. Drawdown in simple words is how much the value of the investment has fallen from its earlier peak.

Notice the big drawdown of almost 60% during the 2008 market crash and also during the Covid crash.
To understand the return possibilities, let us try to understand by taking examples of the 1-year, 3-year, 5-year, and 10-year rolling returns.
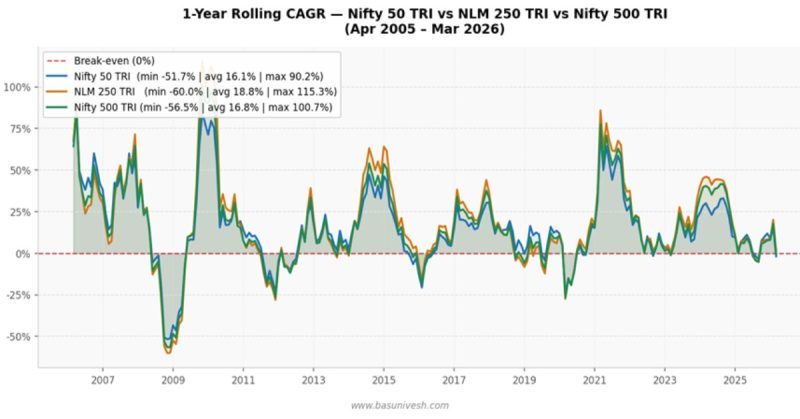
# Nifty 50 1 Year Rolling Returns from 1999 to 2023

Look at the huge deviation and volatility visibility from this data. During the 2008 market crash, the 1-year returns dropped to almost around 50%. The maximum return was 110%, the minimum was -55% and the average was 16%.
# Nifty 50 TRI 3 Years Rolling Return (1999 to 2023)

Even though the negative returns possibility is reduced drastically, you can still expect volatility for 3 years of rolling returns. The maximum return was 61%, the minimum was -15% and the average was 15%.
# Nifty 50 TRI 5 Years Rolling Return (1999 to 2023)

Notice that for year periods, the negative returns are looking thin. But volatility seems to be part of the journey. The maximum return was 47%, the minimum was -1% and the average return was 15%.
# Nifty 50 TRI 10 Years Rolling Return (1999 to 2023)

For those who invested for 10 years or more during the last 24 years, the possibilities of negative returns are almost zero. But it does not mean the journey is smooth. Volatility is reduced when you compare it to other above data. But still, you may notice the volatility. Hence, the journey of 10 years of holding is not so smooth like how the financial industry tells us by looking at point-to-point returns.
During this period, the maximum returns for 10 year holding period were 22%, the minimum was 5% and the average was 14%.
By looking at all the above data, those who are actually concentrating on maximum returns may assume that 1-year returns are fantastic. But be ready for the -55% downtrend in your invested value as both positive and negative are possible for such a short period.
The same applies to 3 years period also. However, even though the negative return possibility was reduced for 5 years and 10 years periods, but still notice the huge deviation in maximum to minimum returns vs the average returns.
Now let us try to understand what may be the returns during those 24 years by breaking into various return categories.

The above image will give you clarity about the return possibilities for various time periods. Notice that the probability of negative returns for 1-year rolling returns is almost 25% and from 0% to 8%, it is 15%. Hence, we can assume that the probability of generating less returns for 1 year holding period is almost 40%.
If you are expecting 12% returns or more for 1 year period, then the probability is 52% with a 40% risk of generating less than 8% returns.
Notice the return possibilities for more than 10% or 12% for the holding periods of 3 years, 5 years or 10 years, you noticed that probability is slowly increasing proportionately the probability of generating less than 8% returns decreases.
What all these data indicate is that if your holding period is more than 5 years or 10 years, then better to expect 10% with a downside risk of 28% and 17% generating less than 10% returns. It means even if you assume a 10% conservative number for your 5-year to 10-year holding period, the failure possibility of generating less than 10% is 28% and 17% respectively.
Hence, never run behind fair recent returns to assume that the future is the same way. Instead, look for the bigger picture like above and notice the LUCK factor also even after holding for medium term (like 5 years) to long term (10 years).
Conclusion –
a) If your holding period is just 1 year, then 40% of time returns may be less than 8% but more than 0%. In this, the probability of zero or less than zero returns is 25%!!
b) If your holding period is 3 years, then the probability of less than 8% but more than 0% returns is 26%. In this, the probability of zero or less than zero returns is 7%.
c) If your holding period is 5 years, then the probability of less than 8% returns but more than 0% is 19%. However, the probability of zero or less than zero returns is reduced to almost NIL.
d) If your holding period is 10 years, then the probability of less than 8% returns but more than 0% is 4%.
Assume that you are expecting 10% to 12% returns from your equity portfolio, then..
a) If your holding period is just 1 year, then 44% of time returns may be less than 10%.
b) If your holding period is just 3 years, then 34% of time returns may be less than 10%.
c) If your holding period is just 5 years, then 28% of time returns may be less than 10%.
d) If your holding period is just 10 years, then 17% of time returns may be less than 10%.
Past returns are not an indication of future returns. However, by looking at past data, you can conclude the return possibilities and accordingly be ready to face downtrends. Just because someone generated 10% or more returns or the fund generated 10% or more returns does not mean you must assume that it may be possible in the future too. It may be possible and may not be. Prepare for what if you are not able to generate the expected return and at the same time hope for better returns. But be realistic rather than expecting too much or a kind of magic. Anything expecting more than 10% from your equity portfolio for your medium to long-term goals (more than 5 or 10 years) is highly risky. Also, from the above data, it is proved that even after holding for a medium to long term, the possibility of less than 10% return is possible!!
can I start SIP for 5 years and then leave it for 5 years without SIP in total 10 years. I have Balanced fund ,Flexi and Debt funds, adequate insurance including health insurance. Nifty 50 index fund I wish to invest additional.
Kindly advice.
Dear Rama,
You can continue the SIP and hold the same amount for as many years you wish to do. No such restrictions.
Dear sir,
Can you write an article for Senior citizen saving scheme
Dear Ankit,
It is already available. Please refer the same “Post Office Senior Citizen Scheme (SCSS)-Benefits and Interest Rate“.
Thank you sir
Hi,
Thanks for insight and your efforts to increase awareness on PF to masses.
I suggest that you should do one article like this 1,3, 5, 10, 15 and 20 years with bank fd (respective tenure as fd rates changes with tenure) and inflation data on rolling or absolute value basis. Ideally with figure like 1 lakh value in respective tenure and categories.
Looking forward for such article sir.
Thanks and regards,
Dear Manish,
In case of Bank FDs, you will not get long term FDs and hence it hardly matters. More than that, the nature of volatility is marginal due to inflation changes as it is not a market linked instrument. Also, why to use Bank FDs for long term goals?
Namaste BasuJi,
Thanks for sharing insight on Nifty50 and its trend for 24years.
Regards,
Krishan
Dear Krishan,
My pleasure 🙂
Hi Sir,
If we want to keep investing in Nifty 50 index fund for long term, does it mean in order to mitigate market risks, we should decide our asset allocation (equity and debt ratio). Yearly rebalance is required to reset equity allocation back to its original ratio. As and when the equity allocation is increased(deviating more than 5%), book some profits and keep in fixed assets like PPF, debt funds, FDs etc. Reverse should also be done if required. Decrease equity exposure as age increases. Sir please correct me if I am wrong. Thanks
Dear Pavan,
Yes, your understanding is correct. Proper asset allocation with yearly review and rebalancing is must.
Respected Basu sir,
Do you have any articles written about yearly rebalancing? Could you please suggest some resources on this topic as well. Thank you.
Dear Karthick,
I will start writing. Good suggestion.
Dear Basu Sir,
Any article on this yearly balancing? It would help to enlighten our knowledge.
Dear Aravind,
It is a long pending. Will do soon.